
 ACTIVE INTEGRATION
ImageTrend + First Arriving
First Arriving shows your ImageTrend data on screens in your stations, workplaces and offices, on desktops and on the go: Continuum charts like turnout times, incident maps and response charts, your Slate roster, plus scheduled emailed reports like ambulance clear times, narcotics checks and truck checks.
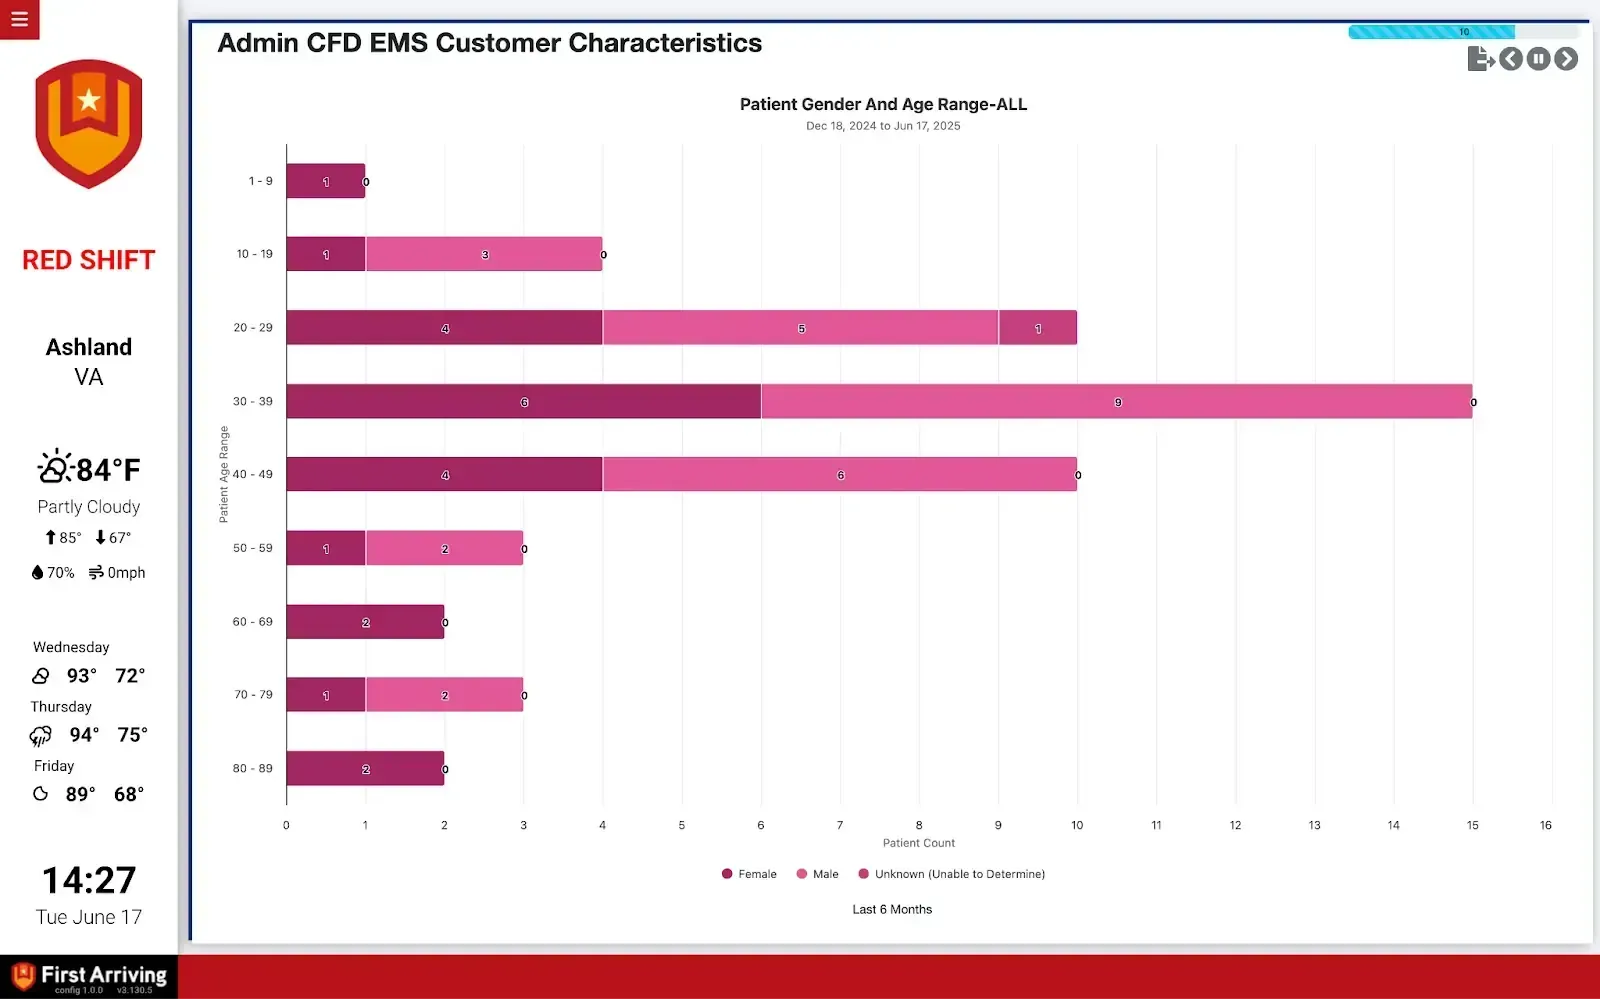
Continuum actively analyzes the data within your system as it is added or updated to provide you with notifications and easy-to-view insights based on the information you need. Best of all, no reports to build. It’s that easy. Continuum offers you the ability to create playlists featuring charts, tabular reports, and/or maps from a variety of different dashboards to be shared both internally and/or publicly for your stakeholders on monitors at your stations, offices, internal/external websites, or other locations. It also offers you the ability to associate URLs with individual charts, tabular reports, and/or maps on any dashboard.
What Connects
Your ImageTrend data on the wall, desktop, and in every pocket.
Continuum playlists
Turnout times, incident maps, and response charts, shared internally or publicly on any dashboard.
Emailed reports
Scheduled reports for turnout times, ambulance clear times, narcotics checks, truck checks, run information, and calls to date.
Display Roster / Slate
Show your ImageTrend Slate roster on your dashboards from a Slate public roster URL.
Sample Views
See it on the dashboard.
Live in four steps.
Give us the playlist URL
The URL to the Continuum content you want to show, e.g. https://department.imagetrendelite.com/Continuum/dept/Continuum/App/Playlist/1.
Send us your email reports
We'll provide a specific email address for your CSV data to be sent to.
Create a public roster in Slate
Navigate to Slate > Settings. Scroll to the bottom of the page and select Advanced > Public Rosters. Select Add New and configure the roster as needed. Once the roster is created, Slate generates a public URL that can be shared with anyone who needs access to the roster data; send it to us.
Additional Note
Data or API access could carry an additional charge. This is determined by the vendor, not by First Arriving.
Frequently asked questions
What shows on the dashboards?
Continuum playlists with turnout times, incident maps and response charts. Scheduled emailed reports can add turnout times, ambulance clear times, narcotics checks, truck checks, run information and calls to date.
Can we display our roster from ImageTrend Slate?
Yes. Create a public roster in Slate: go to Slate > Settings, scroll to the bottom and select Advanced > Public Rosters, then select Add New and configure the roster as needed. Slate generates a public URL for the roster; send it to us and we'll add it to your dashboards.
Do we have to build reports?
No. Continuum actively analyzes the data in your system as it's added or updated, with no reports to build.
What setup is needed?
Give us the URL to the Continuum playlist you want to show. For emailed reports, we provide a specific email address for your CSV data. Data or API access could carry an additional charge, set by the vendor.
Support Center
Full setup details for ImageTrend