
 ACTIVE INTEGRATION
Windy + First Arriving
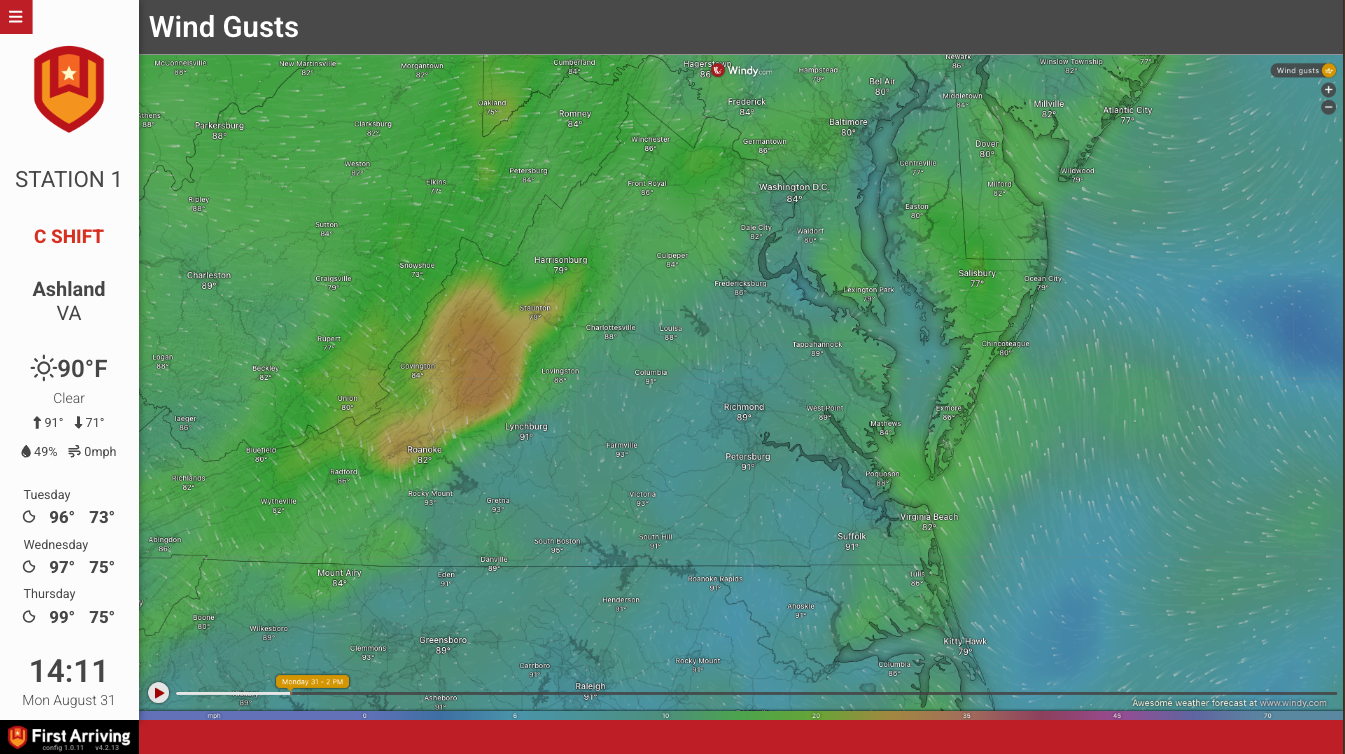
Put a live, interactive Windy weather map on your station dashboard. Crews see wind, radar, temperature and more across your response area at a glance, without opening a browser.
What Connects
What Connects
Watch wind stream across your response area
A live, interactive map shows wind moving over your area, so crews can see developing weather at a glance.
Live radar and satellite
Track incoming precipitation with live radar, or switch to satellite and cloud views to see what's building.
Temperature, icing and wave conditions
Show temperature shading, icing severity or wave conditions, whichever matters most to the way your department operates.
Seven layers to choose from
Pick from base wind, satellite, temperature, radar, clouds, icing severity and waves. Each layer gets its own page, and the pages rotate with the rest of your board.
Centered on your station
By default the map is centered on your station, and you can ask for a different center and zoom level.
Sample Views
See it on the dashboard.
Live in three steps.
Request a Windy map
Open a support ticket and ask us to add Windy to your board.
Choose your layers
Tell us which weather layers you want, and we'll add a page for each one.
Confirm your map view
We center the map on your station by default. If you want a different view, tell us the center and zoom level you want.